In today’s data-driven landscape, financial analysis has evolved significantly. Traditional tools like dashboards provide valuable insights at a glance, but they often fall short in delivering deep analysis and nuanced interpretation. With the rise of Conversational AI, the field of financial analysis is rapidly advancing, enabling deeper insights and more dynamic interactions. In this article, we’ll explore how combining the strengths of dashboards with the capabilities of conversational AI can elevate your analytical capabilities.
The Power of Dashboards in Financial Analysis
Key Features of Dashboards:
- Comprehensive Data Visualization: Dashboards offer various visualizations, such as bar charts, line graphs, and pie charts, to represent different aspects of financial data. Users can quickly grasp the distribution of assets, sector performance, and changes in holdings over time.
- Trend Analysis: By visualizing historical data, users can identify trends in investments. For example, dashboards can highlight which sectors or stocks have seen increased or decreased investments over recent quarters.
- Comparative Analysis: Users can compare the holdings of different entities side by side. This feature is particularly useful for benchmarking and understanding how various strategies perform against each other.
- Drill-Down Capabilities: Dashboards allow users to drill down into specific data points for more detailed analysis. For instance, clicking on a particular stock can reveal which institutions hold it and any recent changes in their positions.
- Customizable Views: Users can tailor dashboards to their specific needs, focusing on particular sectors, institutions, or time periods. This flexibility ensures dashboards remain relevant for diverse analytical purposes.
The Limitations of Dashboards:
While dashboards excel at visualization, they have several limitations:
- Static Nature:
- Predefined Queries: Dashboards typically rely on pre-defined queries and metrics. This means they can only answer questions that were anticipated during the design phase.
- Limited Flexibility: Users are often limited to the views and filters that have been predefined, reducing the ability to explore data freely and dynamically.
- Surface-Level Insights:
- Basic Visualization: While dashboards excel at displaying data through charts and graphs, they often lack the depth needed for thorough analysis.
- Shallow Analysis: Dashboards provide a snapshot of data, but do not easily facilitate deeper analysis such as understanding the underlying reasons behind trends.
- User Dependency:
- Expertise Requirement: Creating and interpreting dashboards often requires a certain level of expertise in both the data being analyzed and the tool being used.
- Learning Curve: Users must spend time learning how to effectively use and navigate dashboards, which can be a barrier for those without technical skills.
- Data Overload:
- Information Overload: Dashboards can present a large amount of information at once, which can be overwhelming and make it difficult for users to identify key insights.
- Cluttered Interface: Poorly designed dashboards can become cluttered with too many visual elements, leading to confusion rather than clarity.
- Lack of Context:
- Contextual Understanding: Dashboards present data but often lack the context needed to fully understand what the data means. This can lead to misinterpretation or oversimplification of complex information.
- Narrative Gap: Dashboards display numbers and trends but do not provide the narrative or reasoning behind those figures, which is crucial for making informed decisions.
The Age of Conversational AI
As financial data grows increasingly complex, the need for more sophisticated analytical tools has become paramount. This is where Conversational AI steps in, revolutionizing the way we interact with data and derive insights. Unlike traditional tools, Conversational AI allows users to engage in natural language dialogue with advanced AI models, enabling a more intuitive and interactive analysis experience.
Key Advantages of Conversational AI:
- Dynamic Interaction: Conversational AI facilitates real-time interaction with data, allowing users to ask questions and receive answers in natural language. This interactive approach makes data analysis more accessible, even for those without technical expertise.
- Deeper Insights: Beyond simple data visualization, Conversational AI can provide in-depth analysis by contextualizing information. For instance, when asked about a spike in a particular stock’s holding, the AI can integrate various data sources, including market news and financial indicators, to offer a comprehensive explanation.
- Personalization: Conversational AI can tailor its responses based on the user’s specific needs and preferences. This personalization ensures that the analysis is relevant and actionable, catering to the unique requirements of each user.
- Enhanced Decision-Making: By combining historical data with real-time updates, Conversational AI supports more informed decision-making. Users can explore different scenarios, forecast outcomes, and receive recommendations based on the latest data trends and insights.
- Accessibility and Ease of Use: The natural language processing capabilities of Conversational AI lower the barrier to entry for financial analysis. Users do not need to be experts in data science or financial modeling to extract valuable insights. This democratization of data analysis empowers a wider range of stakeholders within an organization to leverage data effectively.
Example in Action:
Introduction to Form 13F
Form 13F is a quarterly report filed by institutional investment managers with over $100 million in qualifying assets under management. It provides detailed information on the investment holdings of these institutions, including the types of securities, issuers, and the value of the holdings. This data is crucial for understanding market trends, analyzing institutional investment strategies, and making informed investment decisions.
Understanding Form 13F
Form 13F is a quarterly report mandated by the U.S. Securities and Exchange Commission (SEC) for institutional investment managers who manage over $100 million in qualifying assets. This form provides transparency into the holdings of large institutional investors, offering valuable insights for market participants. Here are key aspects to understand about Form 13F:
- Purpose and Importance:
- Transparency: Form 13F promotes transparency in the market by revealing the investment activities of major institutional investors.
- Market Insight: It provides a snapshot of what significant players in the market are investing in, which can indicate broader market trends.
- Strategy Analysis: Analysts and investors can study the holdings of successful fund managers to glean insights into their investment strategies and decisions.
- Components of Form 13F:
- Security Details: Information about each security, including the name, class, and Cusip number (a unique identifier for securities).
- Holdings Information: The number of shares and the market value of each holding.
- Issuer Information: Details about the issuing company of the securities held.
- Use Cases of Form 13F Data:
- Trend Analysis: Identifying which sectors or securities are gaining or losing favor among institutional investors.
- Comparative Analysis: Comparing the holdings of different institutional investors to understand varying strategies.
- Investment Decision Making: Retail and institutional investors can use this data to inform their own investment choices, either by following successful managers or identifying potential market shifts.
Demonstrating Use-Cases with Form 13F Data
To illustrate the capabilities of both dashboards and conversational AI, let’s use Form 13F data. Form 13F is a quarterly report filed by institutional investment managers with over $100 million in qualifying assets under management. This data provides detailed information on the investment holdings of these institutions, including the types of securities, issuers, and the value of the holdings.
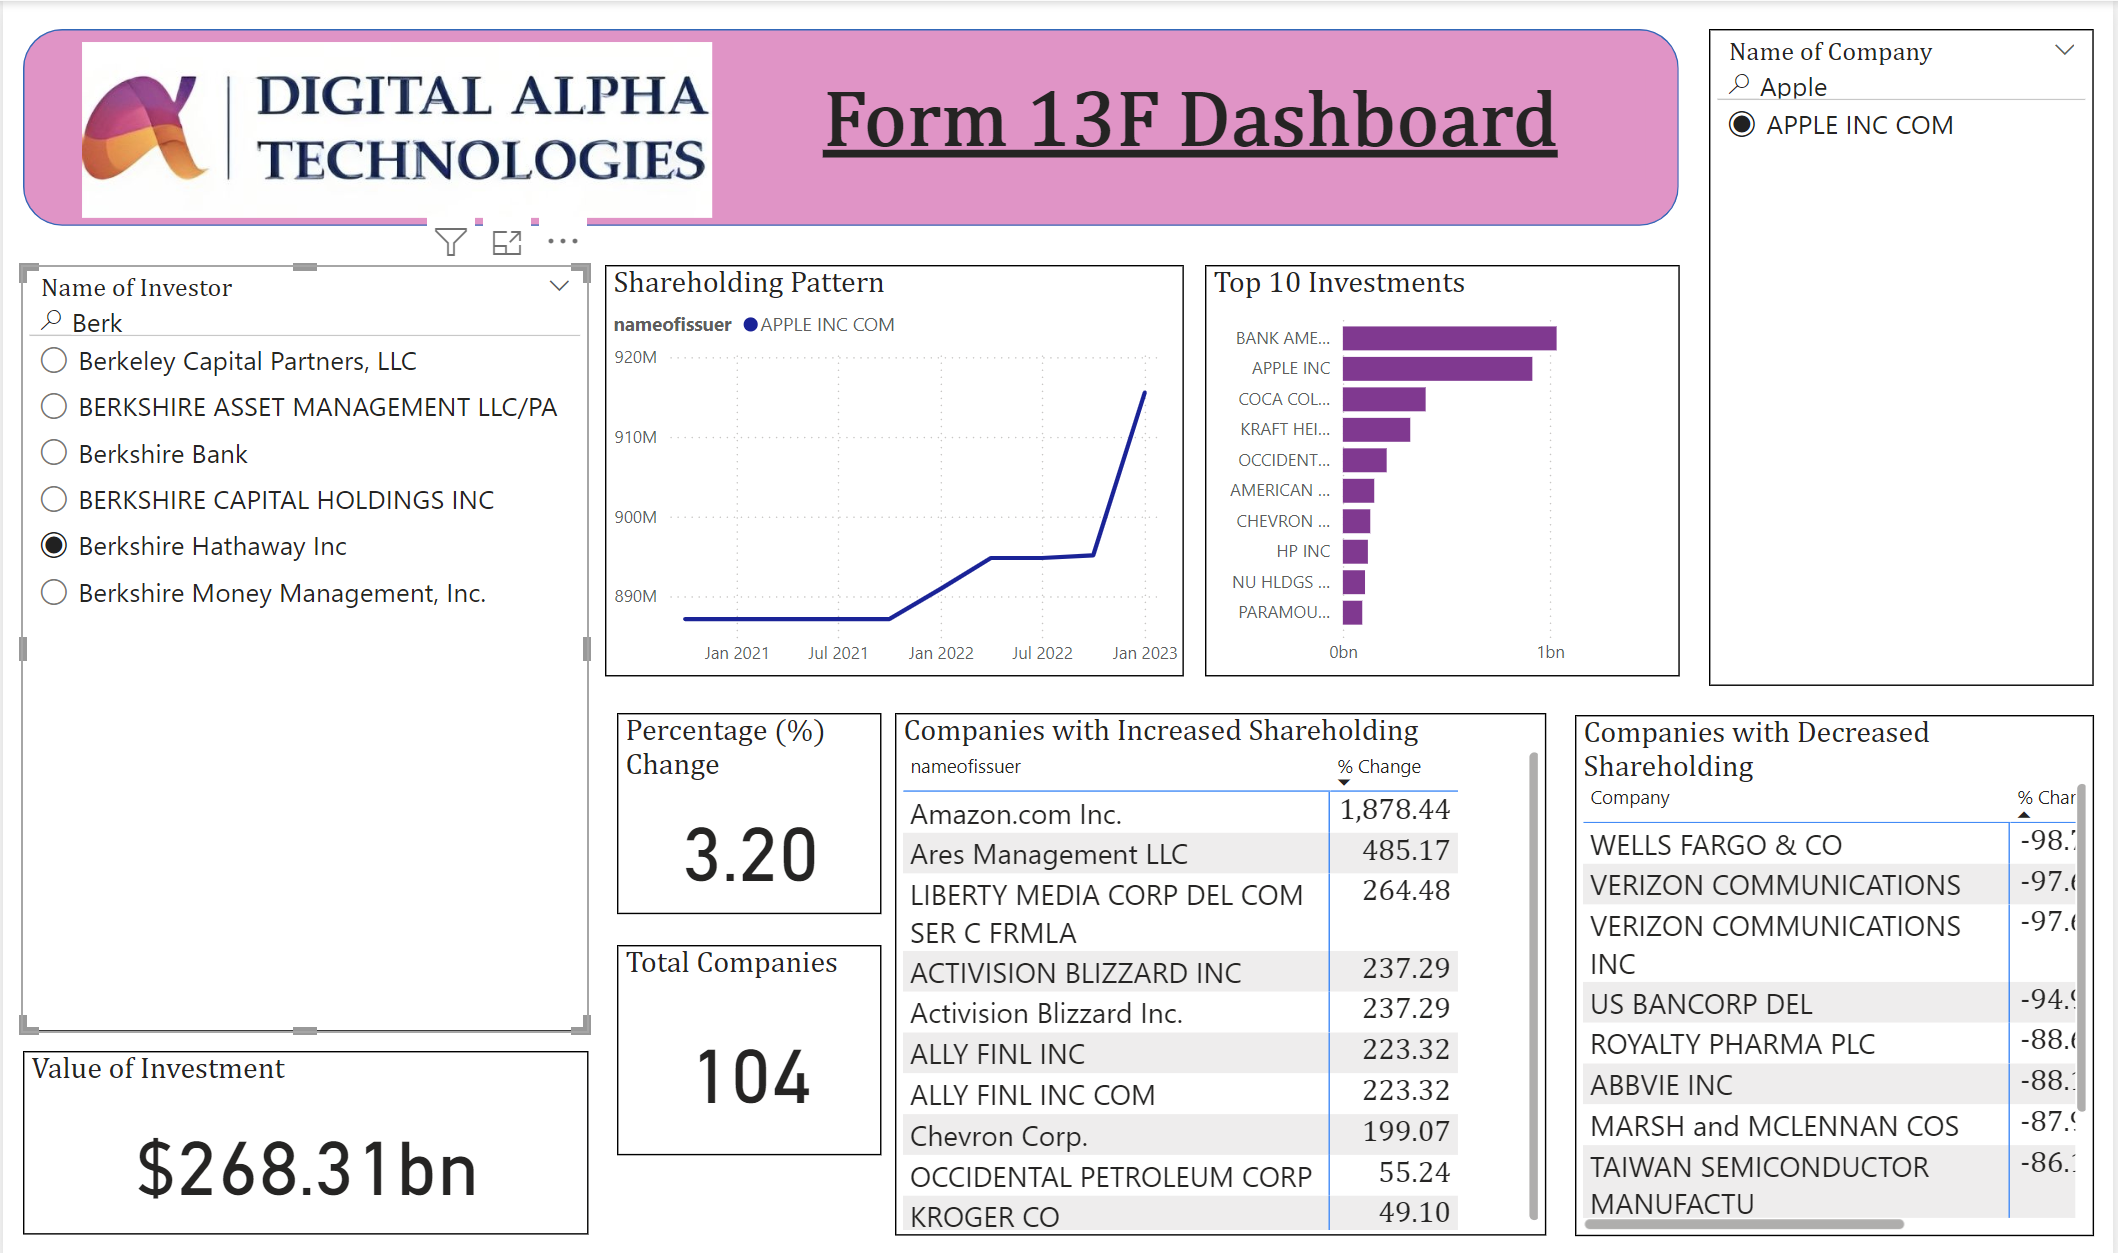
What does the Dashboard tell?
What We Can Ask our Conversational-AI?
Conclusion:
While dashboards remain invaluable for data visualization and monitoring, conversational AI represents the next frontier in financial analysis. By harnessing the power of both tools, organizations can unlock new insights, streamline decision-making processes, and stay ahead in today’s competitive landscape. Whether you’re a seasoned analyst or a novice investor, embracing this synergistic approach can propel you towards smarter, more informed decisions in the dynamic world of finance.
Integrating dashboards and conversational AI not only amplifies the efficiency and depth of financial analysis but also transforms how we interact with data, making the entire process more insightful and impactful.