| Your portfolio companies are leaking $500K–$3M in EBITDA every year and it will never show up on a P&L.
The source is not underperforming. It is the compounding cost of manual work, fragmented systems, and human effort applied to tasks that should be automated. At an 8× exit multiple, eliminating $1.5M of this operational tax creates $12M of incremental enterprise value within a single hold period. A focused 100-day program – diagnosis, integration, and AI deployment is enough to make it measurable, reducible, and permanent. |
Three reasons this matters now:
| $12M Enterprise value per $1.5M operational tax eliminated At an 8× EBITDA exit multiple |
100 Days from diagnosis to measurable ROI No systems replacement required |
8.24× Exit multiple for operationally mature firms vs. 6.62× for fragmented peers |
The Operational Tax Is Real – And It Is Hiding in Plain Sight
Mid-market portfolio companies do not suffer from a lack of revenue. They suffer from a silent, distributed cost that accumulates across every department that still runs on manual work. We call it the operational tax: the aggregate annual expense of fragmented systems, duplicate data entry, spreadsheet workarounds, and human effort applied to tasks that should either not exist or should be fully automated.
It does not appear as a single line item. No CFO has ever received an invoice for it. And yet it is the most consistent value destruction mechanism across PE-backed companies in financial services, professional services, and any data-intensive industry.
| The operational tax does not show up in a single budget line. It is distributed across dozens of workflows, embedded in headcount, and obscured by the habit of calling it ‘just how we do things.’ |
Five Sources Account for the Majority of the Drain
The same five operational failure modes appear across virtually every mid-market company audit. Together they account for $1M–$2.5M+ in annual EBITDA loss for a typical portfolio company:
| Failure Mode | Root Cause | Typical Annual EBITDA Impact |
| Close Cycle Inefficiency | ERP, CRM, and ops systems not sharing a unified data layer | $180K–$350K |
| Manual Document Processing | No automated extraction or classification of unstructured docs | $250K–$500K |
| Customer Service Backlogs | Reps cross-referencing 3–5 systems per inquiry | $300K–$800K |
| Data Reconciliation | No single source of truth across platforms | $200K–$600K |
| Compliance Reporting | Audit evidence assembled manually from spreadsheet extracts | $80K–$250K |
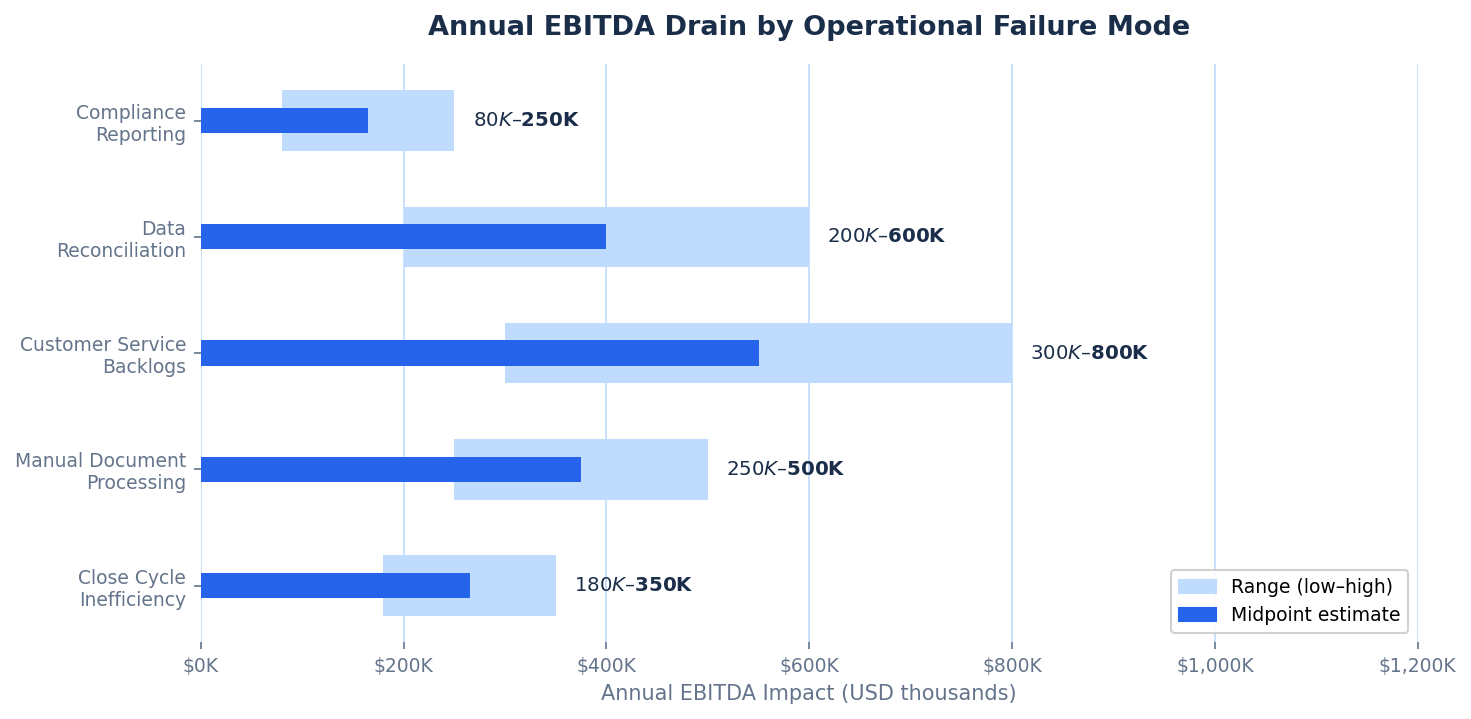
Figure 1: Annual EBITDA drain by operational failure mode — range and midpoint estimates
The Close Cycle Alone Reveals the Scale of the Problem
The monthly financial close is the most visible symptom. Top-quartile companies close in under five business days. The industry median is 8–9 days. Companies running on fragmented systems routinely take 14 or more. That gap – roughly 10 extra business days per month — is not a minor inconvenience. It represents finance team capacity permanently consumed by reconciliation work that integration would eliminate in a single sprint.
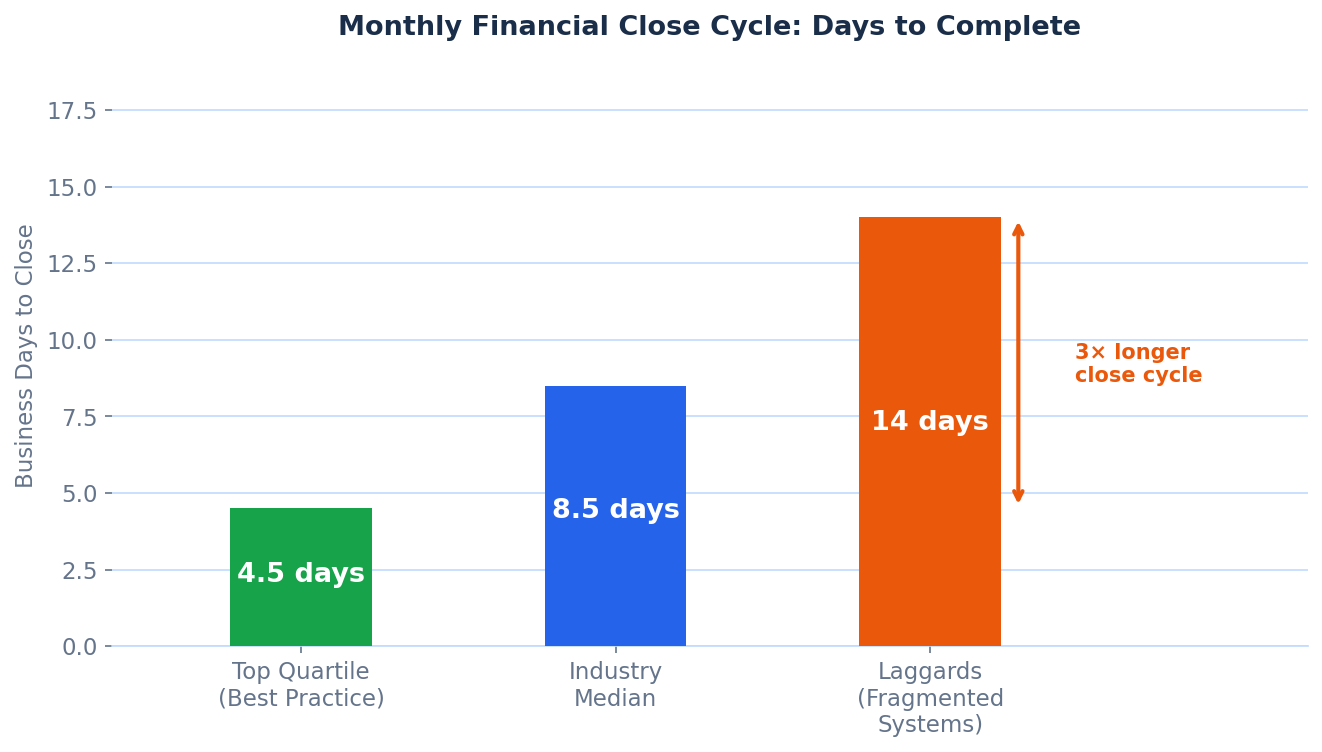
Figure 2: Monthly financial close benchmarks — top quartile vs. median vs. laggards
This Is a Valuation Problem, Not an Operations Problem
The operational tax matters to PE partners for one reason: it suppresses exit multiples. Industry data is unambiguous. Firms that have systematically eliminated the operational tax through integration and AI command an 8.24× EBITDA multiple at exit. Fragmented firms command 6.62×. On a $20M EBITDA business, that difference is $32M of enterprise value.
The mechanism is straightforward. Operational maturity signals to acquirers that the business is scalable — that AUM, revenue, or client volume can grow 2–3× without proportional headcount growth. That signal is worth paying for.
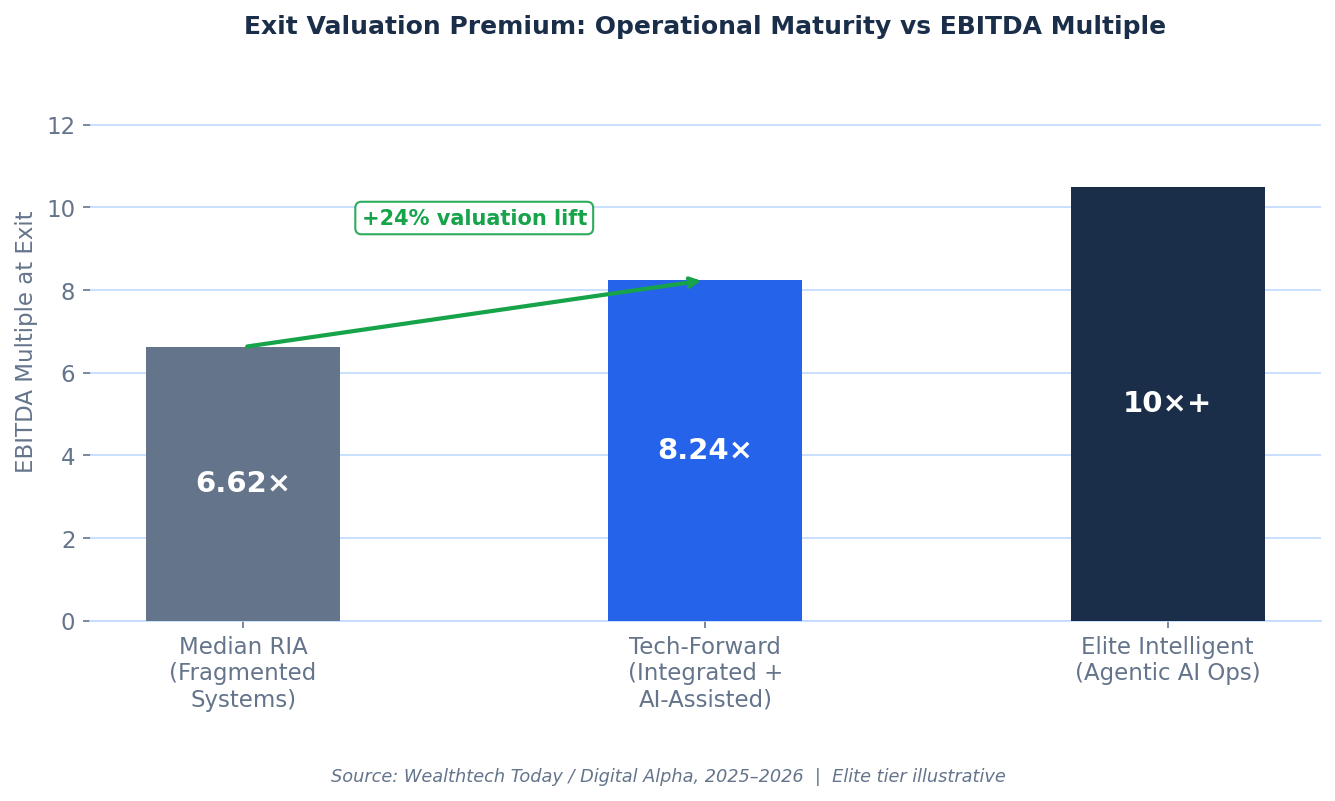
Figure 3: Exit valuation premium by operational maturity — EBITDA multiple comparison
| On a $20M EBITDA business, the difference between a 6.62× and 8.24× multiple is $32M of enterprise value. Operational maturity is not an operational issue. It is the single largest remaining lever for exit value creation. |
The Math: Translating Hours Into Dollars
The EBITDA impact is not difficult to quantify once you know where to look. Each failure mode has a measurable labour cost, an error and rework multiplier, and a downstream impact on revenue or margin. A typical mid-market company running all five failure modes simultaneously is consuming the equivalent of 12–26 FTE annually on work that serves no client, generates no revenue, and creates no competitive advantage.
| Operational Failure Mode | FTE Equivalent Consumed | Error/Rework Multiplier | Annualized EBITDA Impact |
| Close Cycle (10-day vs. 5-day) | 2–4 FTE / month | 1.3× | $180K–$350K |
| Document Processing (manual) | 3–5 FTE | 1.5× (rework cost) | $250K–$500K |
| Customer Service Backlogs | 4–8 FTE + churn cost | 1.4× (NPS impact) | $300K–$800K |
| Data Reconciliation | 2–6 FTE | 2.0× (error cost) | $200K–$600K |
| Compliance Reporting | 1–3 FTE | 1.2× | $80K–$250K |
| Combined Operational Tax | 12–26 FTE equivalent | — | $1M–$2.5M+ |
Applying a conservative 8× multiple to even the midpoint of that range – $1.5M annually – yields $12M of incremental enterprise value available from a single focused operational improvement program. That is not a projection. It is arithmetic.
A 100-Day Program Delivers Measurable EBITDA Impact Without Replacing Core Systems
The most common mistake PE operating partners make is sequencing. They skip straight to AI, deploy point solutions into fragmented environments, and then manage the consequences – broken automations, inconsistent outputs, and a management team that has lost confidence in the initiative. The correct sequence is non-negotiable: integration first, automation second, AI third.
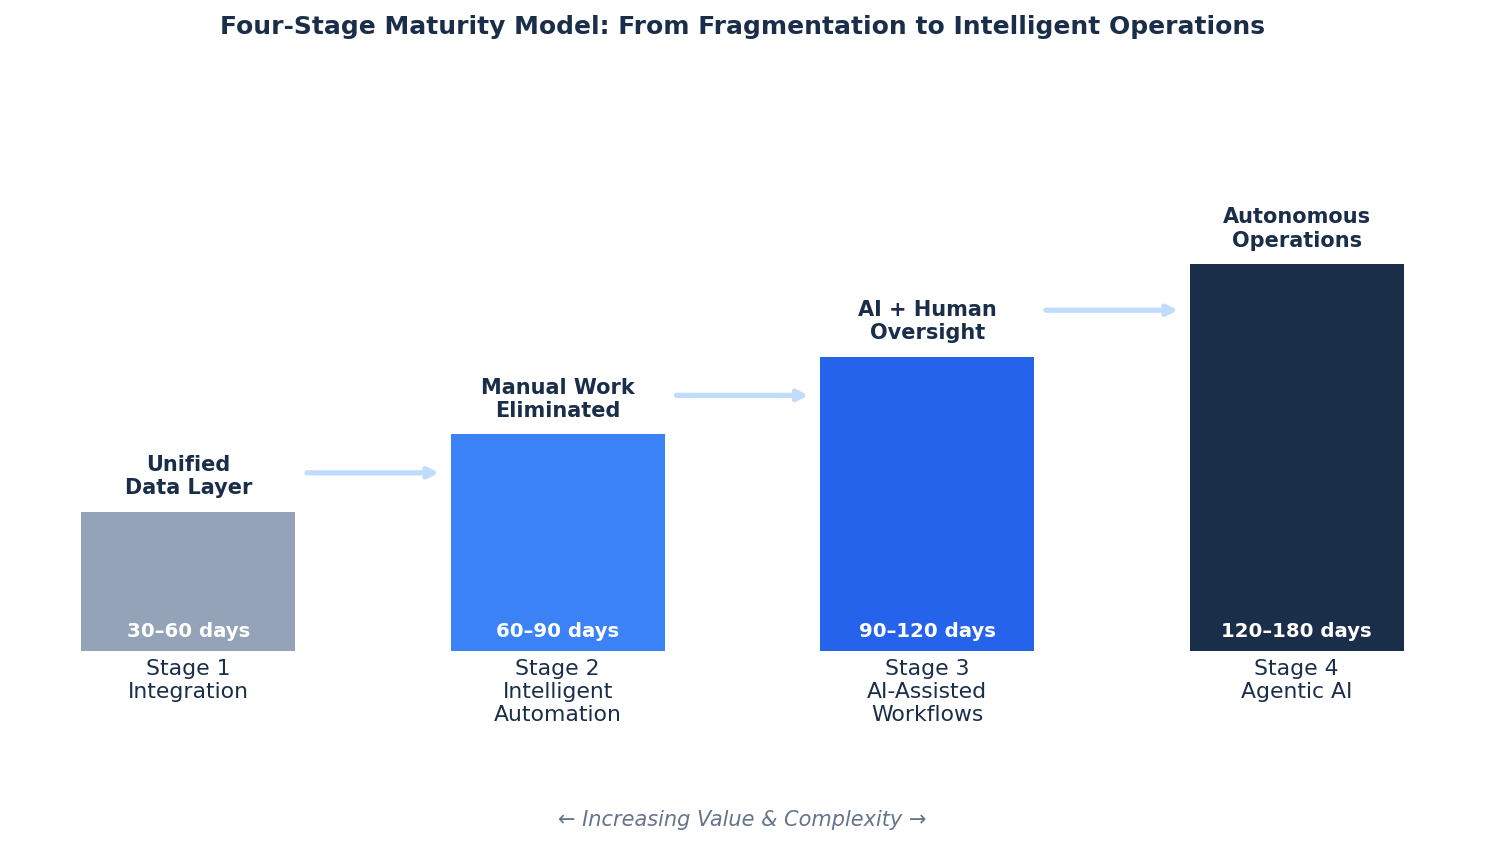
Figure 4: Four-stage operational maturity model — the required sequence
Stage 1 – Is the Only Stage That Cannot Be Skipped
Integration – connecting the three to five core systems into a unified data layer is the prerequisite for everything that follows. AI applied to fragmented data produces fragmented results. Research on firms that deployed AI before integration found they consistently ended up managing ‘broken automations’ and investing more in remediation than they had saved. The firms that got the sequence right achieved 25% better operational outcomes from the same AI investment.
For a mid-market portfolio company, Stage 1 typically means connecting the CRM, the financial platform or ERP, and the document management system into a single source of truth. This alone eliminates most of the manual reconciliation cost within 30–60 days.
Stages 2–4 – Then Compound the Value
Once data flows freely, the playbook accelerates quickly. Intelligent automation handles rules-based tasks – document classification, fee validation, exception routing – without human involvement. AI-assisted workflows surface recommendations for human review, accelerating decisions without removing accountability. And for the most mature firms, agentic AI monitors systems continuously, detects discrepancies, and resolves them within predefined guardrails – the equivalent of a 24/7 operations team that never makes a data entry error.
The 100-Day Execution Path
The operational tax can be meaningfully reduced within a single quarter. The program runs in three disciplined phases:
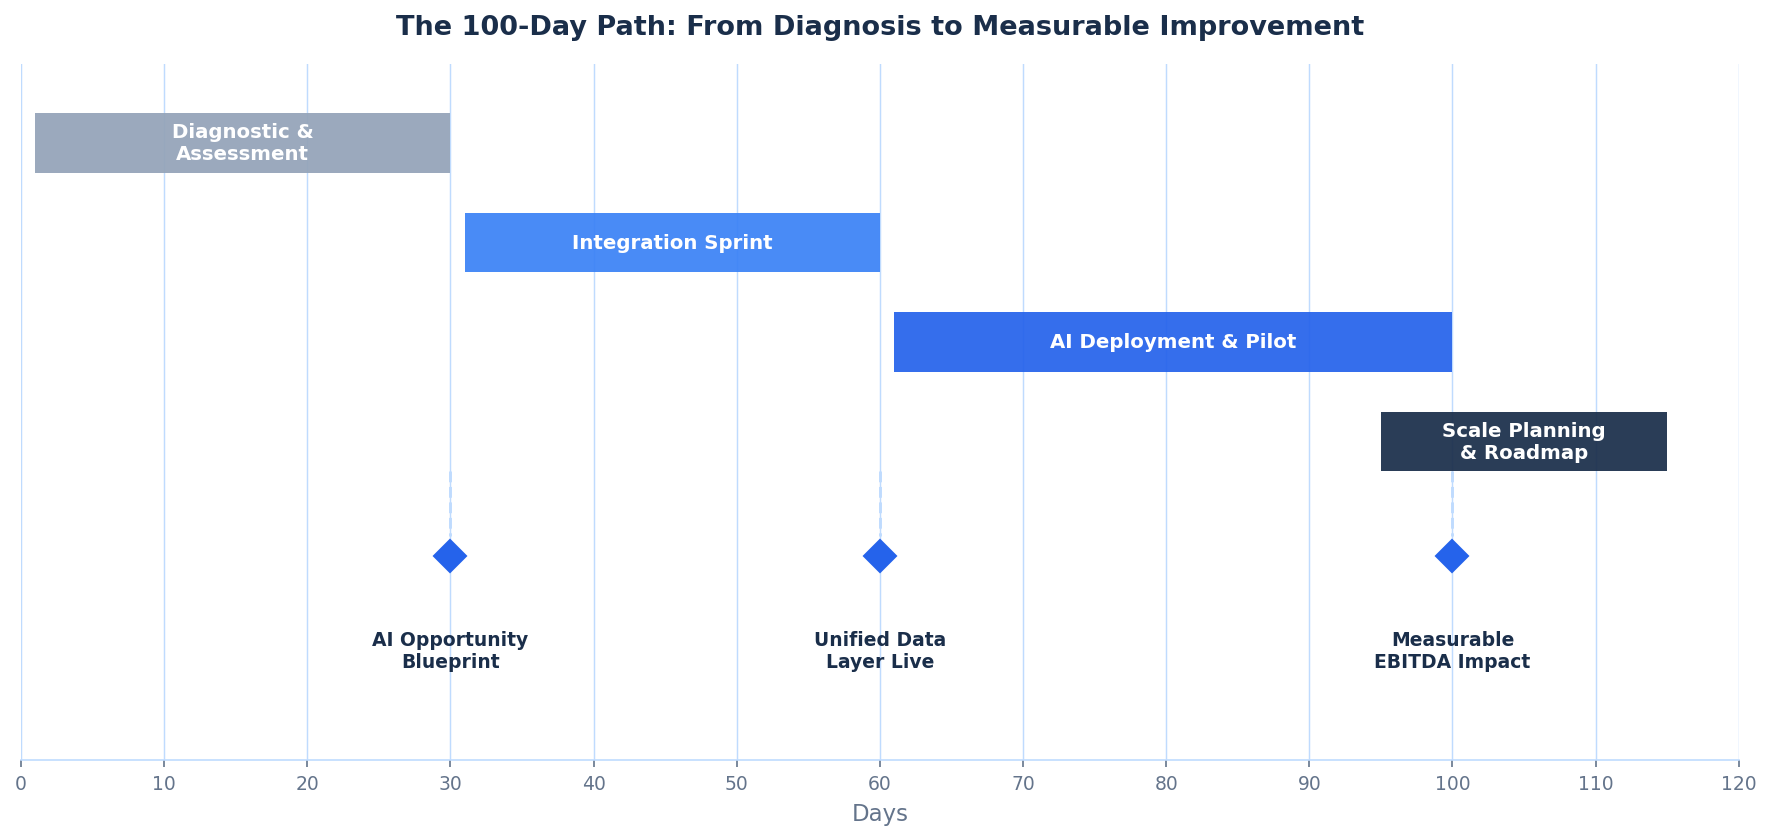
Figure 5: The 100-day roadmap – phases, milestones, and key deliverables
| Phase | Days | What Happens | Deliverable |
| Diagnostic | 1–30 | Map every major workflow. Quantify labour cost, error rate, and integration gap for each. Rank by EBITDA impact. | AI Opportunity Blueprint – prioritized use cases with dollar values attached |
| Integration Sprint | 31–60 | Connect the Big Three systems. Establish unified data layer. Automate synchronization and exception handling. | Live data flow across core platforms. Manual reconciliation ends. |
| AI Deployment | 61–100 | Deploy first AI agent against highest-impact use case. Human-in-the-loop approval workflows. Full audit logging. | Measurable reduction in operational tax. Production-grade, not a pilot. |
| Scale Planning | Day 100+ | Measure ROI. Refine roadmap. Sequence second-wave use cases across remaining failure modes. | 12-month value creation roadmap with each initiative sized in EBITDA dollars |
By Day 100, the firm has three things it did not have before: a precise dollar figure for the remaining operational tax, one working AI deployment with a documented return, and a sequenced roadmap for eliminating the rest. That is the foundation for a credible operational value creation narrative – both internally and with the LP base.
A Documented Proof Point: Bleakley Financial Group
Bleakley Financial Group, a $12B AUM registered investment advisor, faced a version of this problem that appears in virtually every mid-market company audit: manual document processing between their portfolio management system (Orion) and their document storage (Egnyte) was consuming significant operations team time and producing unacceptable error rates.
- Processing time fell by 80% after deploying AWS Textract for extraction and a large language model for validation
- Accuracy improved to 95%+ against a prior baseline of 8–12% error rates
- The operations team was redeployed to client-facing work — the highest-value use of their time
- Compliance evidence packages are now generated automatically with full audit trails
This outcome is not industry specific. The same pattern – manual processing replaced by integrated AI, with measurable EBITDA impact within 90 days has been documented across financial services, professional services, and data-intensive businesses of every size. Next Step:
Start With the Diagnostic
Every portfolio company has an operational tax. The only variable is whether you know the exact dollar figure and whether you are eliminating it fast enough to matter at exit.
A structured AI Opportunity Assessment delivers that number. It maps the five failure modes against your specific workflows, quantifies the EBITDA impact of each, and produces a sequenced 100-day roadmap with every initiative sized in dollars. The assessment takes five business days. The typical ROI identified is $500K–$2.5M annually.
| The firms commanding 8.24× exit multiples are not buying more technology. They are eliminating the operational tax systematically, in sequence, with measurable results at every stage. |
|
Free AI Opportunity Assessment Map your portfolio company’s top operational tax sources. Quantify the EBITDA impact. Receive a prioritized 100-day roadmap at no cost. Designed for PE operating partners and portfolio company COOs. Typical assessment: 5 business days. Typical ROI identified: $500K–$2.5M annually. Contact Digital Alpha · digital-alpha.com/capital-markets |