| $412K Value created in 6 months |
5.8x ROI on implementation |
78% Close cycle reduction |
The Monthly Close Problem: Why It Persists and Why It Matters
| Bottom line: PE-backed companies that compress their month-end close from 18 days to 4 unlock more than just operational efficiency. They create measurable enterprise value. One of these portfolio operating companies generated $412K in value within six months, delivering a 5.8x return on its close-transformation investment. |
The average portfolio operating company still requires 14 to 18 days to close its books each month. That figure has barely shifted in a decade, despite significant investments in ERP systems, business intelligence tools, and finance headcounts.
The main issue is the same across wealth management firms, and other data-heavy businesses are fragmented. Finance teams are not slow because they lack talent; they are slow because their systems don’t work well together.
A typical PE-backed portfolio company runs its general ledger in one platform, its accounts payable in another, consolidations in a spreadsheet, and intercompany eliminations through email. Each month, the close devolves into a manual reconciliation exercise; the same data is verified across disconnected systems, the same journal entries rekeyed, the same variance explanations are drafted from scratch.
The cost extends beyond operations. Every day the books remain open is a day of leadership making decisions on stale data.
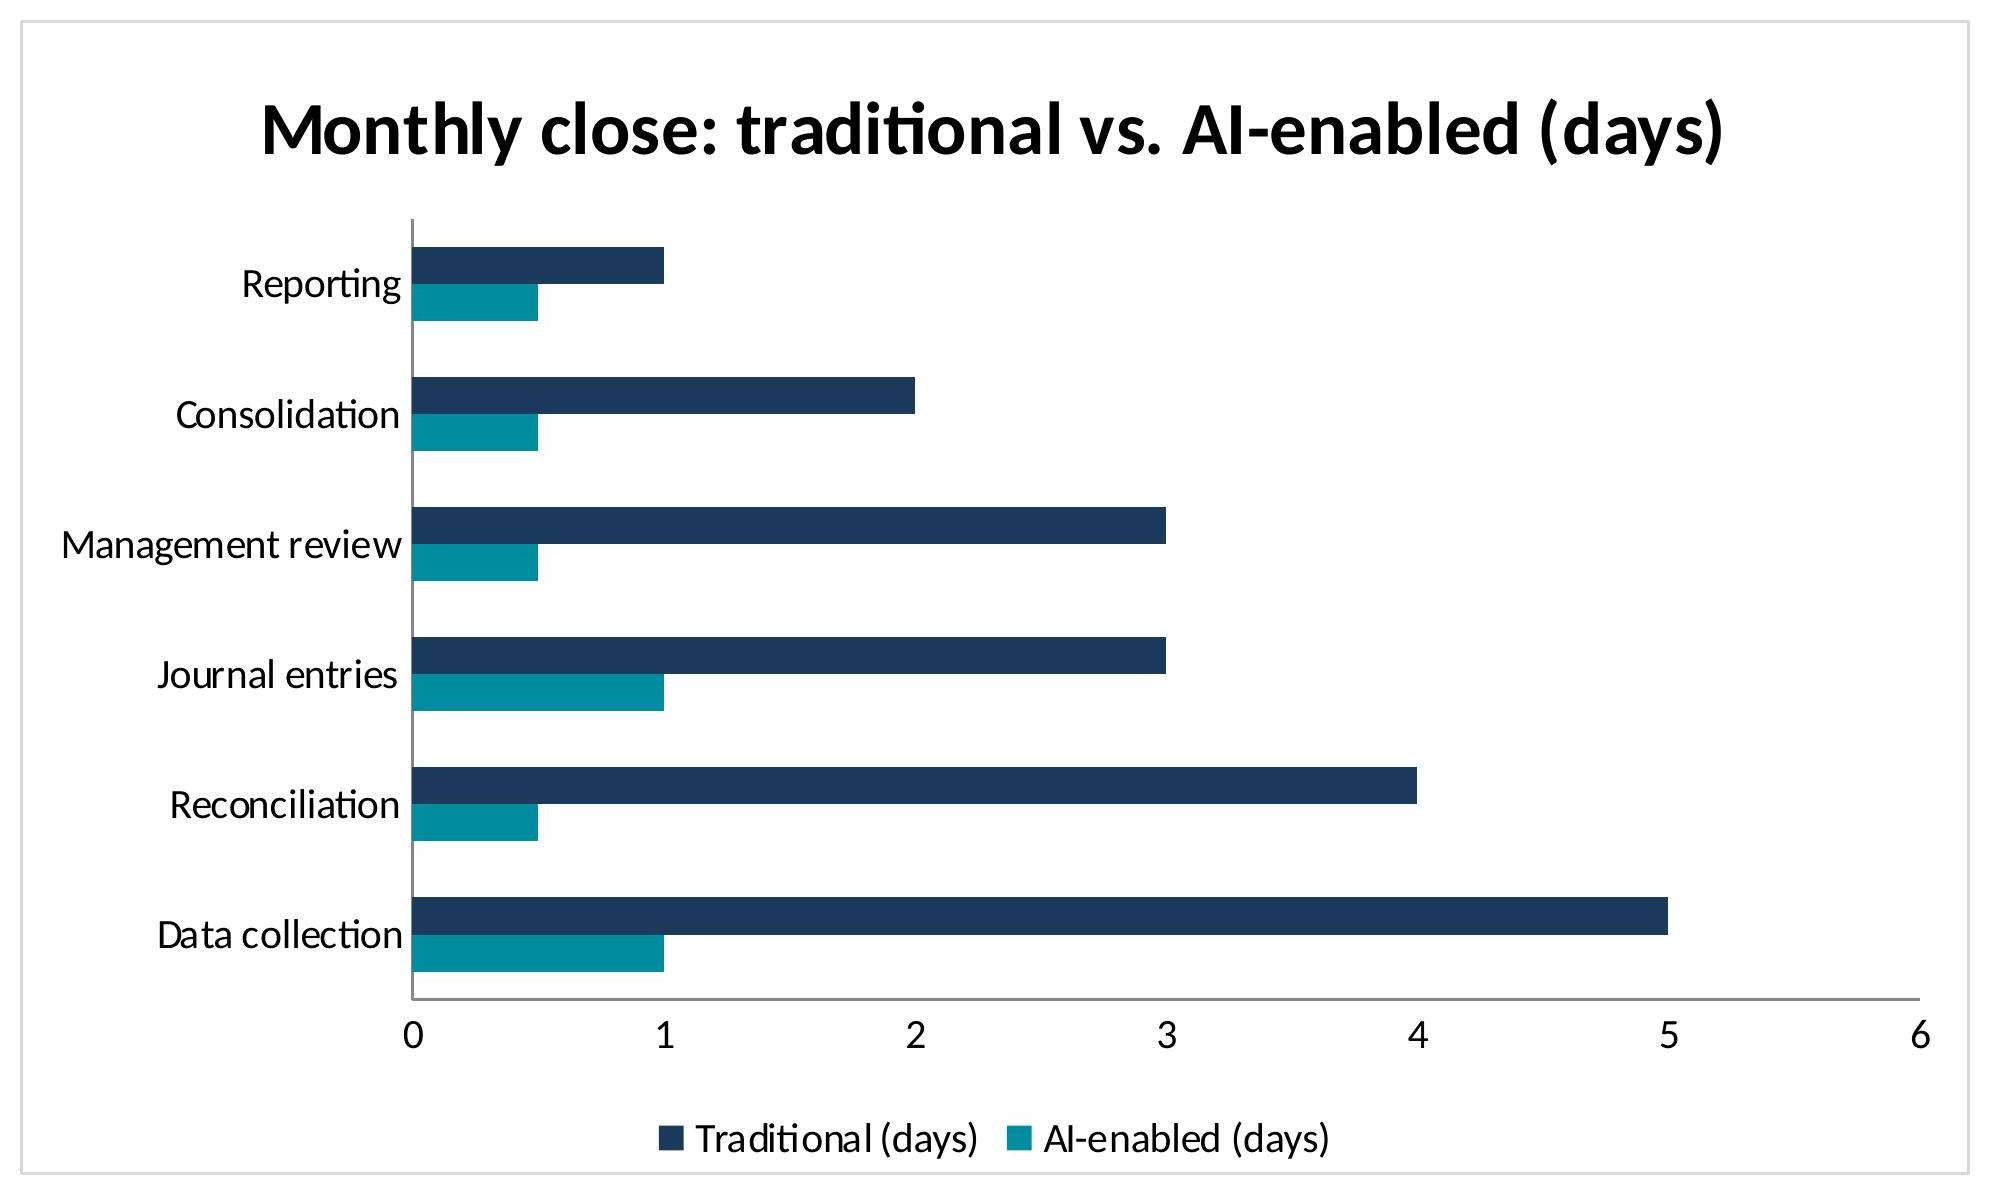
Exhibit 1: Traditional close processes consume 18 days across six sequential phases. An AI-enabled close compresses them to 4.
The EBITDA Math: What an 18-Day vs. 4-Day Close Means for a $25M EBITDA Company
| For PE operating partners, the close cycle is not an accounting issue. It is a value creation issue. |
Consider a portfolio company generating $25M in annual EBITDA. When the books take 18 days to close, leadership operates on financial data that is effectively three weeks old by the time decisions are made. For a 100-day value creation plan, 60% of each month passes before the team has a clear financial picture.
The financial impact compounds across three dimensions:
Faster variance detection. Identifying a 2% EBITDA variance two weeks earlier on a $25M base represents $500K in potential recovery. Conservatively, firms capture half of that, or approximately $250K annually.
Labor reallocation. A finance team of 6 to 8 people spending 60% to 70% of its time on close-related activities represents $200K to $300K in annual fully loaded cost that could be redirected to strategic FP&A and scenario modelling.
Exit signaling. Buyers and their diligence teams increasingly treat close cycle time as a proxy for management of quality and operational maturity. A 4-day close signals a well-integrated, scalable operation.
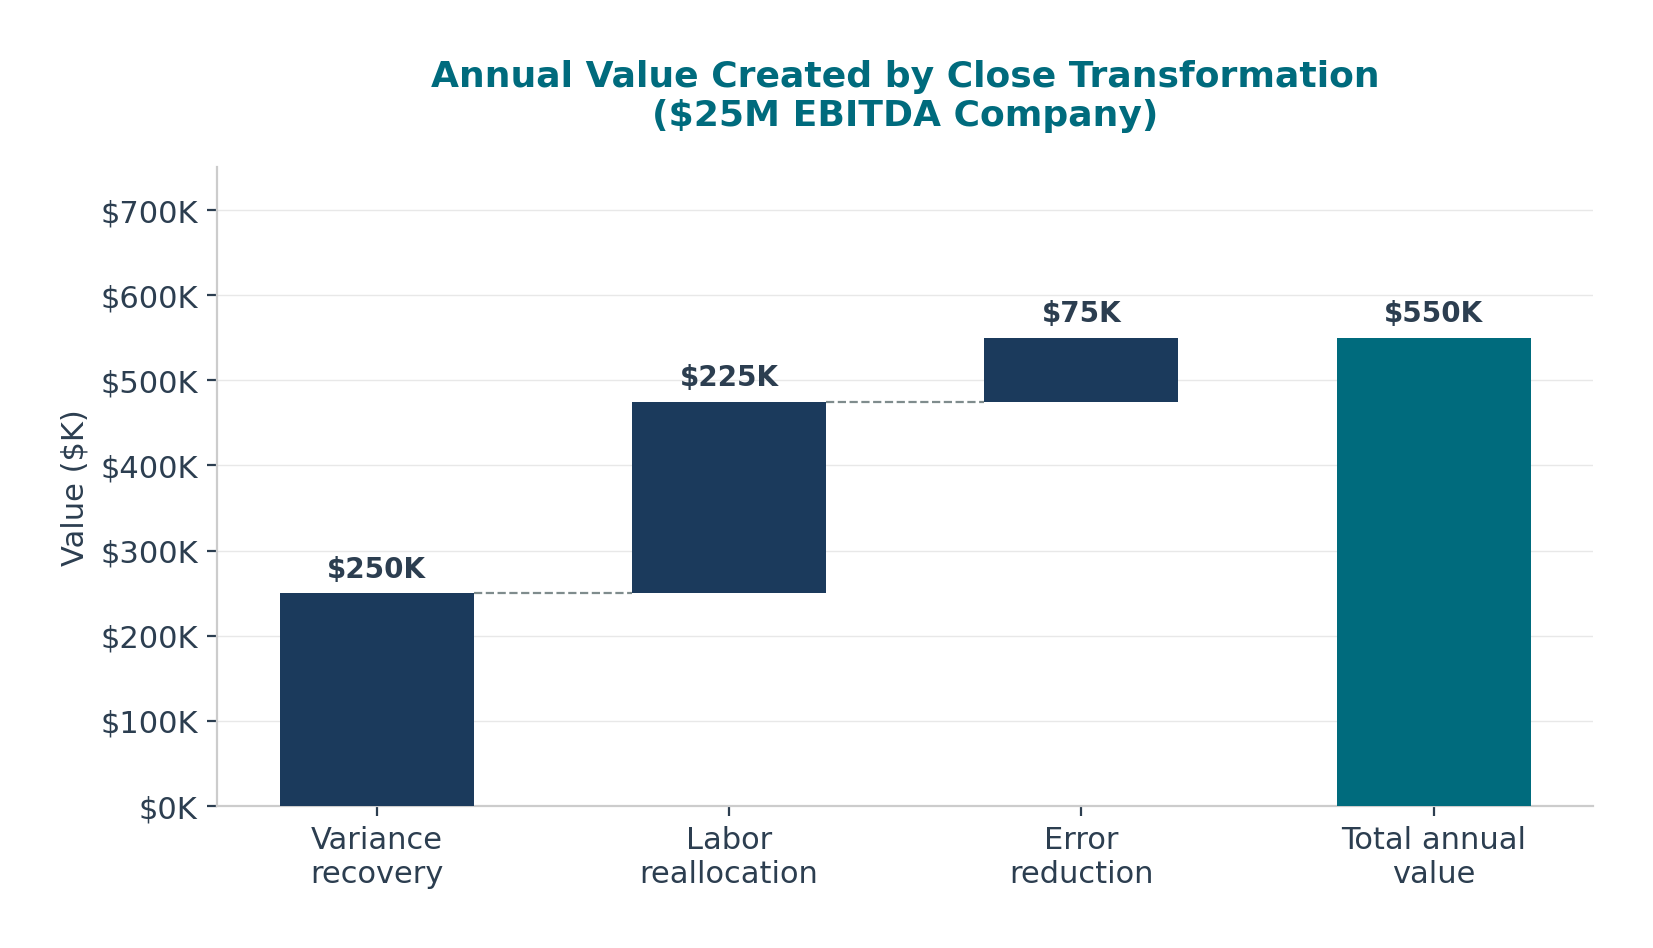
Exhibit 2: Annual value created by close transformation for a $25M EBITDA company, totaling $550K across three sources.
At a 12x EBITDA multiple (common in PE-backed financial services), every $100K in recurring EBITDA improvement translates to $1.2M in enterprise value at exit. A close transformation producing $550K in annual value represents approximately $6.6M in potential valuation impact.
The Three Components of the Close Transformation
Compressing the close from 18 days to 4 is not a single technology purchase. It demands a sequenced approach across three interdependent components, following the same integration-first philosophy that defines successful technology transformation in wealth management.
| Component | Description | Impact |
| Component 1 Automation |
API-based integration, sub-ledger synchronization, and bank reconciliation | Saves 8–10 days |
| Component 2 Intelligence |
AI classifies 80% of journal entries; routes 20% requiring judgment to human reviewers | Saves 5–6 days |
| Component 3 Visibility |
Real-time dashboards, automated variance alerts, continuous close monitoring | Validation only |
Component 1: Automated data collection and reconciliation. Most of the close time (typically 8 to 10 of the 18 days) is consumed by extracting data from disparate systems, reconciling accounts, and resolving discrepancies manually. Automating sub-ledger-to-general-ledger reconciliation, bank matching, and intercompany eliminations remove the single largest bottleneck.
Component 2: Intelligent journal entries and exception management. Once data flows automatically, AI can classify transactions, generate routine journal entries, and flag exceptions for human review. The model handles the 80% of entries that are routine and predictable while surfacing the 20% that require professional judgment with full context and recommended actions.
Component 3: Real-time visibility and continuous monitoring. The final shift is moving from a periodic close to a continuous close. Instead of waiting until the end of the month, teams can see real-time P&L on dashboards, and issues are flagged as they happen. This makes the actual close much simpler; it becomes a quick check of numbers that leadership has already been tracking throughout the period.
| Key principle: Integration must precede intelligence. Just as wealth management firms must connect their “Big Three” systems before layering AI, finance teams must establish automated data flows before any intelligence layer can function effectively. |
The Always-On Finance Model: Continuous Close in Practice
The 4-day close is not the end of the state. It is the bridge to an “always-on finance” model in which the books are never truly “open” because financial data is validated and reconciled in real time.
Under this model, the monthly close becomes what it should always have been: a brief confirmation exercise rather than a multi-week operational project. The finance team’s role shifts fundamentally. Instead of devoting 60% to 70% of its time to close mechanics, the team redirects that capacity toward forward-looking FP&A, scenario modeling, and strategic analysis. This is precisely the work PE sponsors expect but rarely receive from mid-market companies.
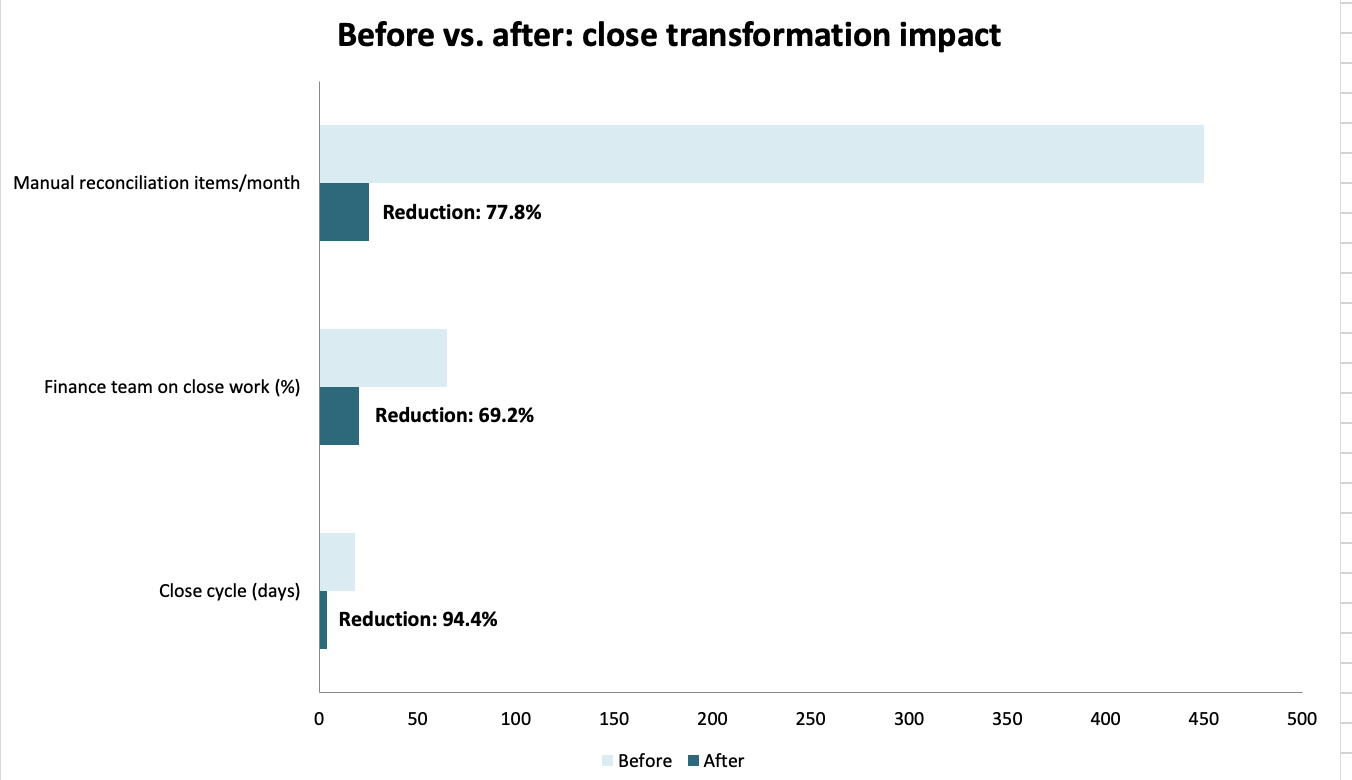
Exhibit 3: Transformation impact across four key operational metrics, before and after implementation.
The operational architecture mirrors the four-stage maturity model used in wealth management intelligent operations.
- Stage 1 establishes the data integration layer.
- Stage 2 automates repetitive close tasks.
- Stage 3 introduces AI-assisted review and exception handling.
- Stage 4 deploys continuous monitoring agents that detect anomalies, flag variances, and generate management-ready explanations, all without waiting for month-end.
For PE-backed companies specifically, the always-on model delivers a critical advantage during board reporting cycles. Rather than presenting financials that are three to four weeks of stale, the CFO can provide real-time performance data with drill-down capability, enabling the board and operating partners to act on current information instead of historical snapshots.
Case Study: $412K Value Created in 6 Months, 5.8x ROI
| $412K Value created (6 months) |
$71K Implementation cost |
5.8x Return on investment |
18 → 4 Close cycle (days) |
A PE-backed mid-market financial services company with $25M in revenue and an 8-person finance team deployed an integrated close transformation over a 90-day implementation window.
Before the Transformation
The company’s monthly close averaged 18 business days. The finance team maintained 14 separate spreadsheets to manage intercompany eliminations alone. Reconciliation between the ERP and banking platforms required manual extraction, and variance analysis was performed retroactively, meaning management routinely discovered margin issues four to six weeks after they materialized.
The Implementation
The first 30 days focused on integrating the ERP with banking and sub-ledger systems through automated API connections, eliminating the manual data collection phase. The next 30 days introduced intelligent automation for journal-entry classification and reconciliation matching, reducing the review burden by 75%. The final 30 days deployed real-time dashboards and continuous monitoring, completing the shift to a 4-day confirmation close.
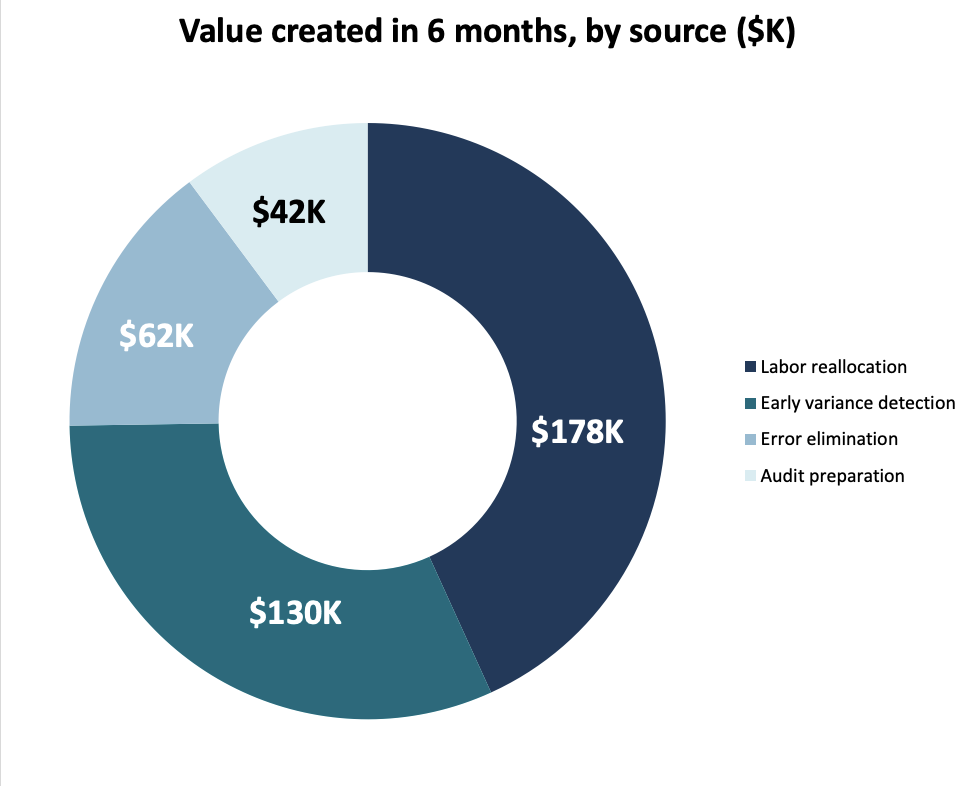
Exhibit 4: Value breakdown by source. Labor reallocation and early variance detection drove 75% of the total $412K.
Results After Six Months
Labor reallocation was the largest value driver. The finance team’s capacity shifted from close mechanics to strategic analysis, enabling the CFO to deliver the forward-looking FP&A that PE sponsors expect but rarely receive from mid-market companies.
Early variance detection was the second-largest source of value. The continuous monitoring system identified a revenue recognition issue in month three that would have gone undetected for six weeks under the previous process, representing $130K in recovered EBITDA.
Error elimination and audit preparation savings rounded out the total, with automated reconciliation cutting data-entry errors by 90% and reducing annual audit preparation from weeks to days.
| The $71K implementation cost (covering integration engineering, AI configuration, training, and three months of operational support) delivered full payback within the first 60 days of production operation. |
The CFO’s Roadmap: What 100 Days Looks Like
For CFOs and PE operating partners ready to act, the 100-day transformation follows a deliberate sequence. Rushing to AI without first building the integration foundation is the most common, and most expensive, mistake. It is the same sequencing error that 2025 Kitces Research identified as the primary failure mode in wealth management technology transformation.
| Timeline | Phase | Description | Deliverable |
| Days 1–14 | Assessment & Architecture | Map the current close process to end. Identify data sources, manual handoffs, and reconciliation bottlenecks. | Close transformation roadmap with ROI projections |
| Days 15–45 | Integration & Automation | Deploy API integrations between the ERP, banking, and consolidation systems. Automate sub-ledger reconciliation and data collection. | Automated data layer with reconciliation engine |
| Days 46–75 | Intelligence Layer | Deploy AI-assisted journal entry classification and exception routing. Implement continuous monitoring of dashboards. | AI-powered close with real-time visibility |
| Days 76–100 | Optimization & Handoff | Execute the first 4-day close cycle. Complete performance tuning, team training, and SOP documentation. | Production 4-day close with 12-month optimization plan |
Exhibit 5: The 100-day CFO roadmap: assessment, integration, intelligence, and optimization.
| Critical principle: Firms that skip Phase 2 and jump directly to AI-assisted journal entries will find themselves automating broken processes, producing faster errors rather than faster close cycles. |
Exit Implications: What Buyers Ask About the Close Cycle in Due Diligence
The financial close has moved from a back-office detail to a front-page diligence item. PE buyers and their advisors increasingly treat close cycle time as a leading indicator of three factors that directly affect deal economics.
Operational maturity. A company that closes in 4 days demonstrates integrated systems, trustworthy data, and a finance team operating at a strategic level. An 18-day close signals fragmentation, manual dependency, and likely hidden data quality issues that will surface post-acquisition.
Scalability without a headcount. Buyers evaluate whether the target can absorb add-on acquisitions without proportionally growing its finance team. A 4-day close built on integrated automation can absorb a bolt-on’s financial data in weeks. An 18-day close built on spreadsheets requires additional headcount for every acquisition, eroding the operating leverage thesis.
Quality of earnings reliability. A faster close means the numbers in the confidential information memorandum are more current and more thoroughly validated. Diligence teams spend less time on confirmatory work and more on strategic analysis, accelerating the deal timeline and reducing the probability of post-LOI price adjustments.
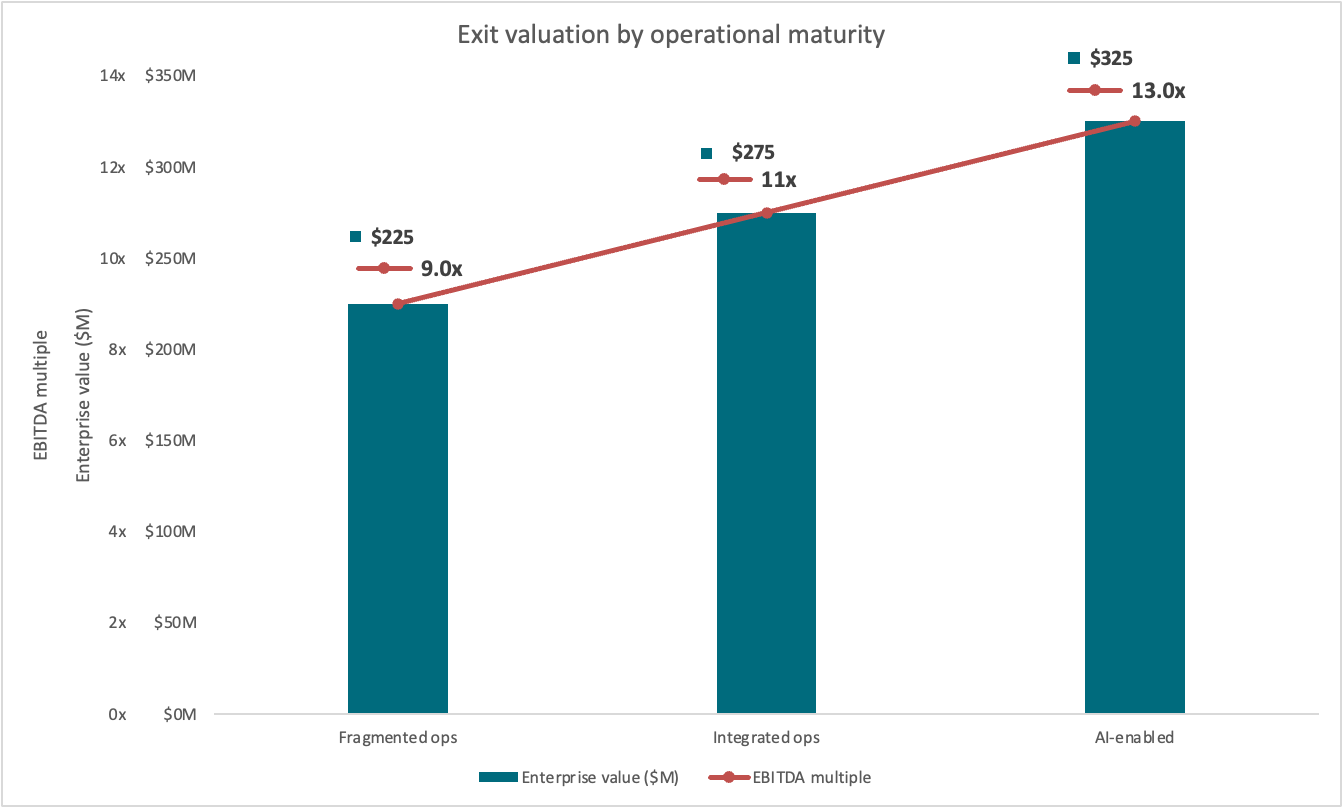
Exhibit 6: Operational maturity correlates with exit multiples. Diamonds represent EBITDA multiples; circles represent enterprise value. AI-enabled continuous close commands a significant premium.
Data from the wealth management industry reinforces this pattern. The 2025 Kitces Research found that tech-forward firms with integrated operations command an 8.24x EBITDA multiple, compared with 6.62x for entirely median firms, a 24% premium attributable to operational infrastructure. The same dynamic applies across PE-backed companies in every sector: buyers pay a premium not for technology itself, but for what technology enables. Clean data, fast decisions, scalable operations, and a finance function that acts as a strategic asset rather than a cost center.
Conclusion: The Close Is Not an Accounting Problem. It Is a Value Creation Lever.
The 18-day close persists not because it is necessary, but because it is familiar. The fragmentation that sustains it (disconnected systems, manual reconciliation, spreadsheet workarounds) is the same operational drag that the 2025 Kitces Research identified as the single largest obstacle to advisor wellbeing and firm scalability in wealth management.
The path from 18 days to 4 follows a disciplined sequence: integrate first, automate second, add intelligence third. This is not a technology project; it is a value creation initiative that produces measurable ROI within the first 90 days, strengthens the quality of earnings narrative at exit, and builds the operational infrastructure that enables PE-backed companies to absorb acquisitions without proportional headcount growth.
| For PE operating partners evaluating the next lever in their portfolio, the question is not whether to transform the close. It is how quickly they can begin. Every month at 18 days is a month of stale data, missed variances, and enterprise value left on the table. |
Key Takeaways
| 18 → 4 days Close cycle reduction |
$412K Value in 6 months |
5.8x ROI On $71K investment |
$6.6M+ Valuation impact at exit |